 |
| Figure 7; Comparing Median After-Tax Household Income Source: Statistics Canada 14-21 |
Residents' Ability to Pay
Household Income
|
|
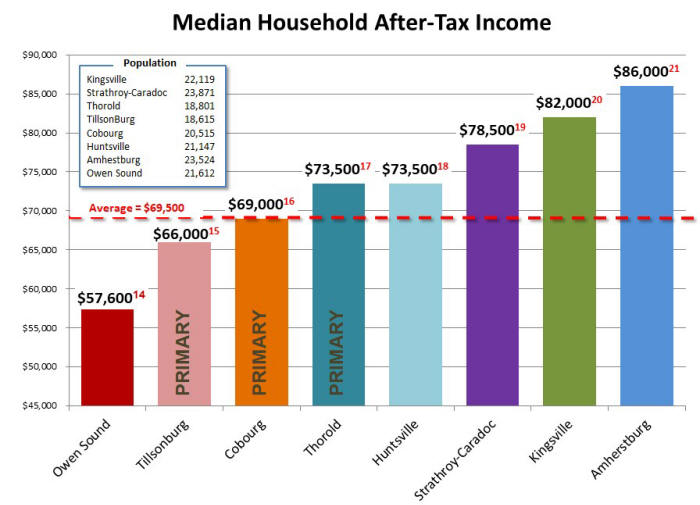
| Figure 7; Comparing Median After-Tax Household Income Source: Statistics Canada 14-21 |
To date the ability for residents to fund municipal operations has not been a consideration when setting the annual budget. As shown above in figure 7, Owen Sound’s residents are the poorest among the comparators. The median household income for Cobourg, a municipality nearly identical to Owen Sound, is very close to the average of $69,500 while Owen Sound’s median household income of only $57.600 is well below other municipalities. Median is the Middle value separating the greater and lesser halves of a data set, i.e. half our population is living on less than $57,000 per household. Although most of these households are renters, landlords pass on their tax expense to their tenants in higher rents.
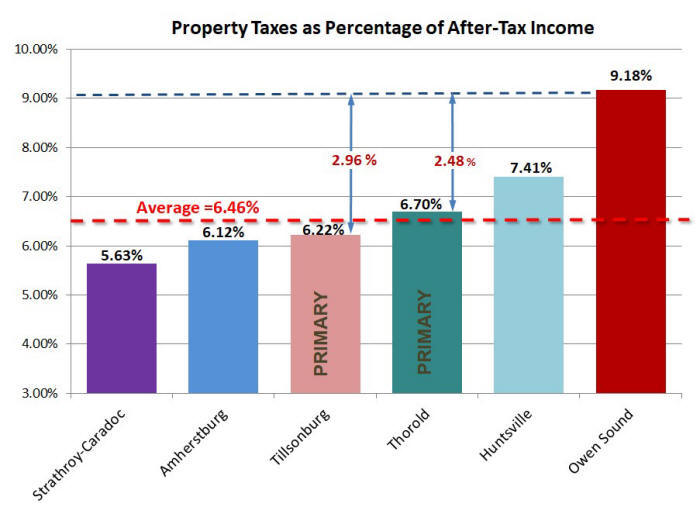 |
| Figure 8; Percentage of After-Tax Household Income Required to Pay Property Taxes Source: Statistics Canada 14-21 |
In regard to resident’s ability to pay municipal taxes it is helpful to consider the percentage of after tax income a resident requires to pay their taxes. Figure 8 above shows that an Owen Sound resident must use 9.18% of their household income to cover municipal taxes while residents of the top three comparators require only 6.46% of their income.
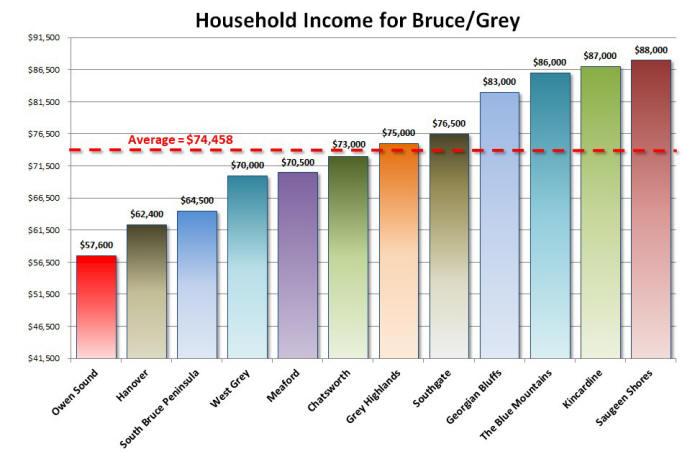 |
| Figure 9; Median After-Tax, Household Income Comparison Source: Statistics Canada 14-21 |
Now that we’ve seen how Owen Sound’s household incomes compare to similarly sized municipalities in the study group I thought it would be informative to look at how Owen Sound household incomes compare with municipalities in Grey/Bruce Counties. As shown in figure 9 above Owen Sound’s median after-tax household income is much lower than the Grey/Bruce Counties average of $74,458.
What’s interesting in this chart is how Owen Sound compares to its closest neighbours, Meaford and Georgian Bluffs. As you can see our neighbours to the west in Georgian Bluffs are quite wealthy compared to us with a median after-tax household income of $83,000. Meaford with a household income of $70,500 is also doing quite well in comparison with Owen Sound, as is Chatsworth at $73,000. It seems like we are surrounded by relative wealthy neighbours. Perhaps we should ask all of them to help us out with the cost of the regional services we provide them such as the Harry Lumley Bayshore Community Center, the Julie Macarthur Recreation Center and the Tom Thomson Art Gallery.
What Could Taxes Be If Ability to Pay was Considered
If Owen Sound taxes were 6.46% of the median after tax household income ($57,600) instead of the current 9.18%, the taxes on the average household would be $3,617 instead of $5,235. Owen Sound’s current revenue from taxation is $31,702,602. If Council capped taxes at 6.46% of media, after-tax household income to match that of Cobourg, Owen Sound’s revenue from taxation would be $22,286,929. Therefore based on resident’s ability to pay, Owen Sound’s revenue from taxation should have been no more than $22 million in 2021 instead of $31,702,602.
|
|
| Figure 10; What a 2021 Tax Comparison would look like if EQUITY were to be Considered |
As a result of Council not considering resident’s ability to pay in 2021, Owen Sound residents were over taxed by $9.8 million, based on their ability to pay. This would have resulted in a 31.5% reduction in taxes for Owen Sound Residents.
Cobourg, a municipality nearly identical to Owen Sound, has a median household after-tax income which is 19.7% higher than Owen Sound’s. As shown in the hypothetical chart in figure 10, Cobourg’s revenue from taxation was $25.2 million in 2021 as compared to the hypothetical $22 million which is what Owen Sound’s would have been if ability to pay were considered.
What is most alarming is that there is evidence that suggests that Owen Sound’s median, after-tax household income will be declining relative to Cobourg’s. The number of people filing income taxes on wages in Cobourg grew by 2,530 workers or 26.9% between 2017 and 202152. During this same period this figure grew by only 260 or 1.9% in Owen Sound.
|
SUMMARY |
|
1. Owen Sound residents are by far the poorest in the study group at 17.1% below the average. 2. Owen Sound residents spend 9.8% of their after-tax household income on property taxes. 3. If the ability to pay was considered Owen Sound’s Tax revenue would be $9.8 million less. 4. Owen Sound high taxes may be driving residents to nearby lower taxed municipalities. |