 |
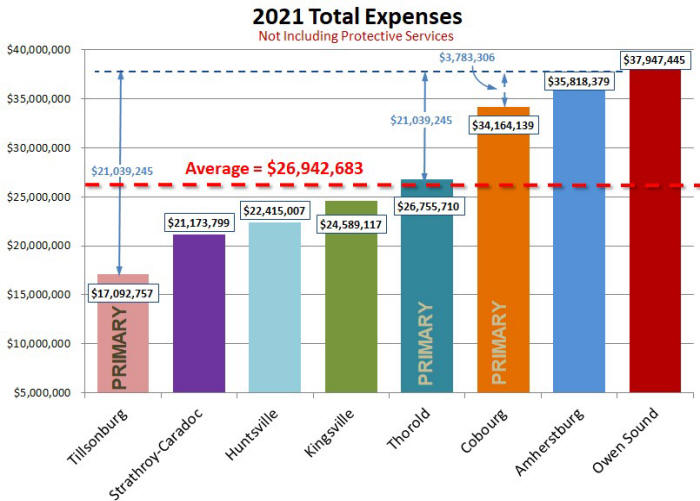
| Figure 11; Comparing Total Expenses Source: Audited Financial Statements 6 - 13 |
Comparing Total Expenses
Total Expenses
|
|
In order to eliminate some of the complexities when comparing services with other municipalities I did not include any expenses associated with Fire and Policing Services. |
|
|
|
| Figure 11; Comparing Total Expenses Source: Audited Financial Statements 6 - 13 |
The chart shown in figure 11 was created using each municipality’s Audited Financial Statements. It’s interesting to note that Owen Sound spends $11.0 million more than the average of the 3 primary comparator municipalities to provide services. When we consider only the closest comparator, Cobourg, we see that Owen Sound spends $3.8 million more on services than Cobourg. Therefore If Owen Sound reduced expenses to match only those of Cobourg, Owen Sound taxpayers would realize an 11.9% reduction in taxes.
When we neutralize the impact of population by calculating municipal expenses per capita as shown in figure 8 below we see that Owen Sound expenses remain the highest of all of the comparators. In fact Owen Sound’s expenses at $1,756 per capita are $424 higher than the average of the 3 primary compactors which is $1,332 per capita. Although $424 per resident doesn’t seem like a large amount when you consider that Owen Sound’s median household income is only $57,600 it is very significant.
Expenses per Capita
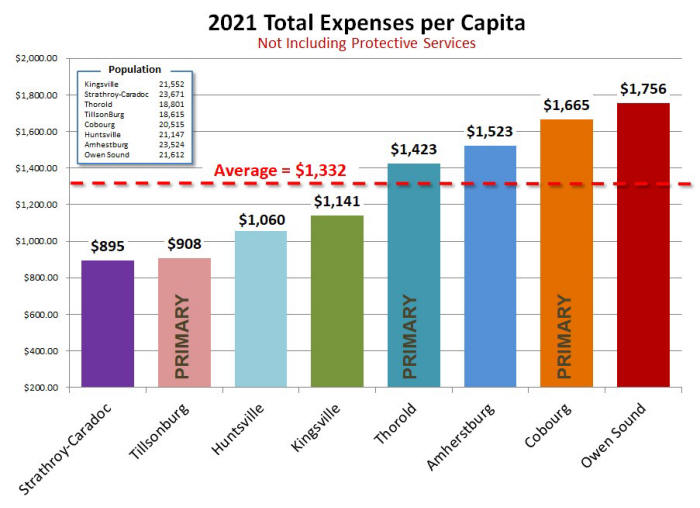 |
| Figure 12; Total Expenses per Capita Source: Source: Audited Financial Statements & StatsCan |
Salaries & Benefits Expense
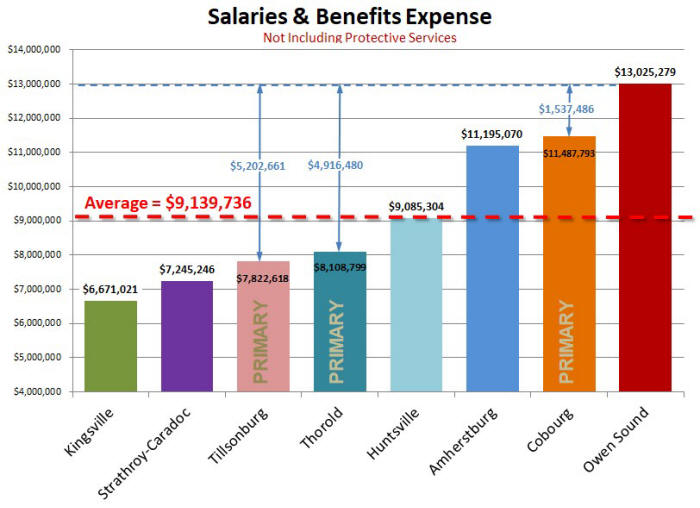 |
| Figure 13; Salaries & Benefits Expense Source: Audited Financial Statements |
As shown is figure 13 above, Owen Sound’s Salaries and Benefits expenses are $3.9 million greater than average of 3 primary comparators and $1.5 million more than Cobourg. If we assume an average salary of $65,000, that would work out to be 23.6 employees more than Cobourg. This also suggests that Salaries and Benefits expenses represent about one-third (35.4%) of the $11 million in excessive expenses.
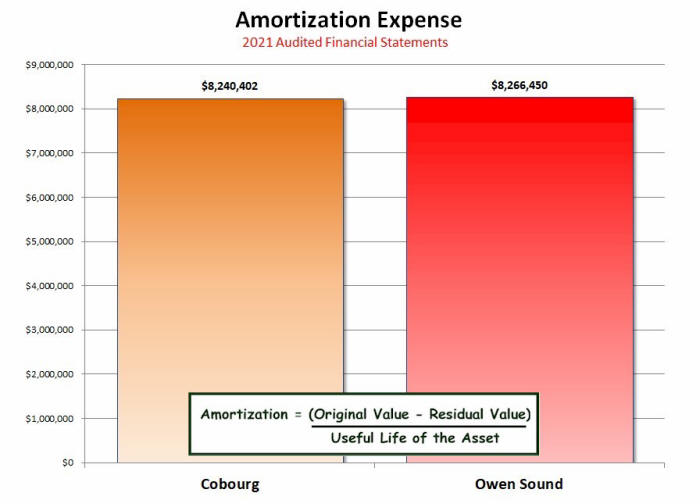 |
| Figure 14; Comparing Amortization for Owen Sound and Cobourg Source: Audited Financial Statements 1 - 11 |
Amortization is an accounting method for spreading out the costs for the use of a long-term asset over the expected period the long-term asset will provide value. Figure 14 above shows the Amortization Expense for Owen Sound and municipality of Cobourg. This essentially means both municipalities have made similarly sized capital investments. Figure 15 shows that Owen Sound’s Debt Servicing Expense is significantly greater than Cobourg’s. Conversely, Cobourg spends only 17.8% of what Owen Sound spends annually to service its debt. This can only mean that Owen Sound has had to assume much more debt to fund those capital investments. The average debt servicing expense for the three primary comparators was only $235,240 in 2021 which is only 23.1% of what Owen Sound spends annually.
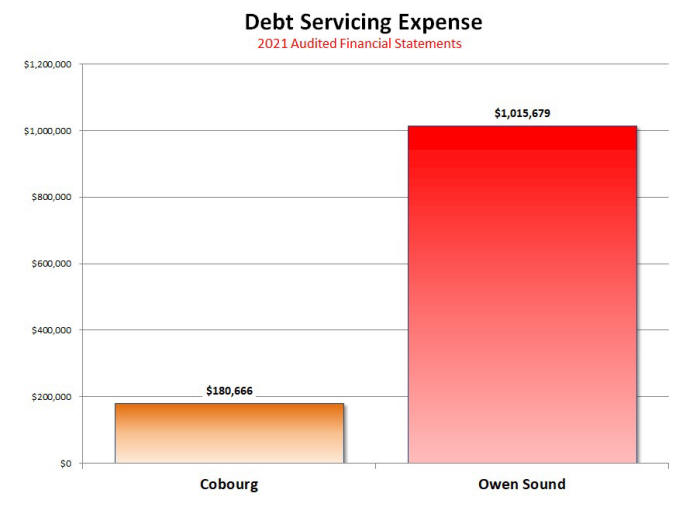 |
| Figure 15; Comparing Debt Servicing for Owen Sound and Cobourg Source: Audited Financial Statements 1 - 11 |
To see how significant the magnitude of Owen Sound’s debt servicing expense is I thought that it would be revealing to look at the debt of other municipalities beyond the study group. The 2022 BMA Municipal Study Report shows the Total Debt per Capita for their participating municipalities. Figure 16, below, shows the debt per capita for municipalities with populations between 15,000 and 29,999.
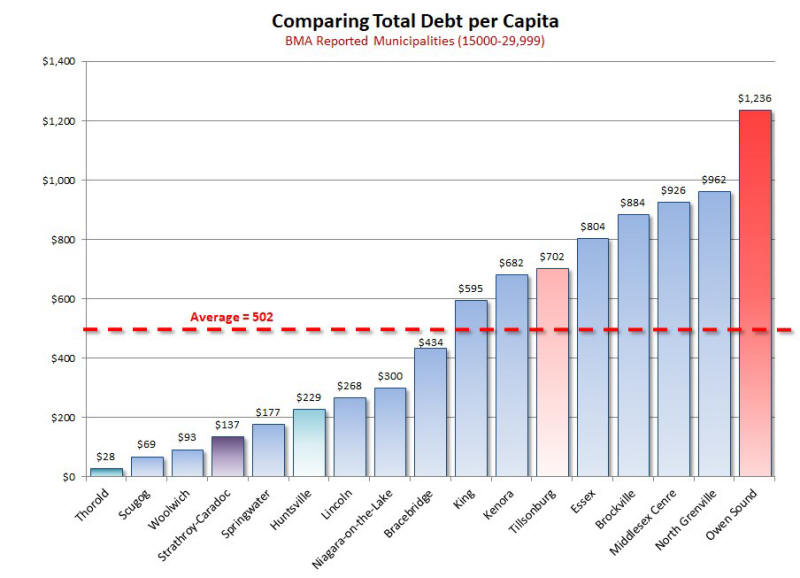 |
| Figure 16; Comparing Total Debt per Capita Source 2022 BMA Reports64 |
Note: Not every municipality with a population between 15,000 and 29,999 is shown here. That’s because not every municipality uses BMA services. However, there are enough municipalities in the chart above to give us a good feeling for how Owen Sound’s debt load compares with other Ontario municipalities in this population range.
So, what do the results shown in figure 16 actually mean? Well, it clearly shows that Owen Sound is carrying an abnormally large debt load as compared to other municipalities with populations between 15,000 and 29,999. Owen Sound has a total debt of $1,236 per resident. This is $734 per resident greater than the average of $502 per resident. The nearest municipality from the study group, is Tillsonburg, which has a total debt per capita of $702 per resident which is only 56% of Owen Sound’s.
The significance of this is not the debt itself but rather the annual debt
servicing or interest charges which adds to the city’s total annual expenses. As
we saw in figure 15, Owen Sound is paying over one million dollars annually in
interest charges which is significantly higher than other municipalities.
Excessive Budget Growth Examples
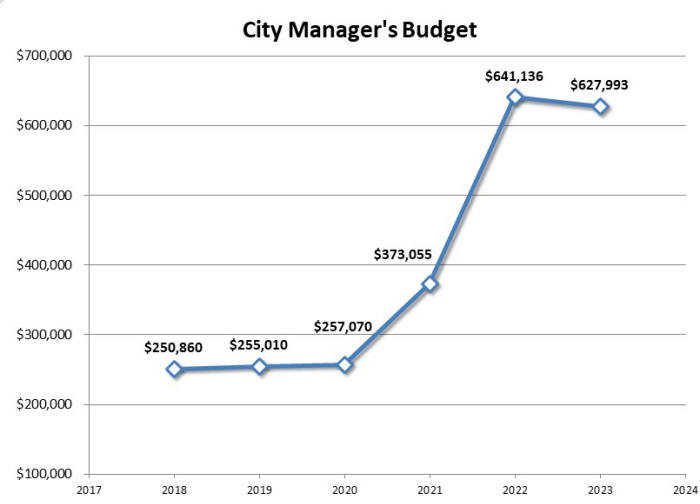 |
| Figure 17; City Manager’s Budget Growth Source Owen Sound Budgets61 |
Figures 17 and 18 show two examples of excessive budget growth that exemplify the problem of spending growth at city hall. In regard to the city manager’s his budget grew by 150% in just two years.
The Tom Thomson Art Gallery budget changes between 2018 and 2922 are shown below in figure 13. As you can see the Art Gallery’s budget grew by 77.3% in only four years, while inflation grew by only 3.47%.
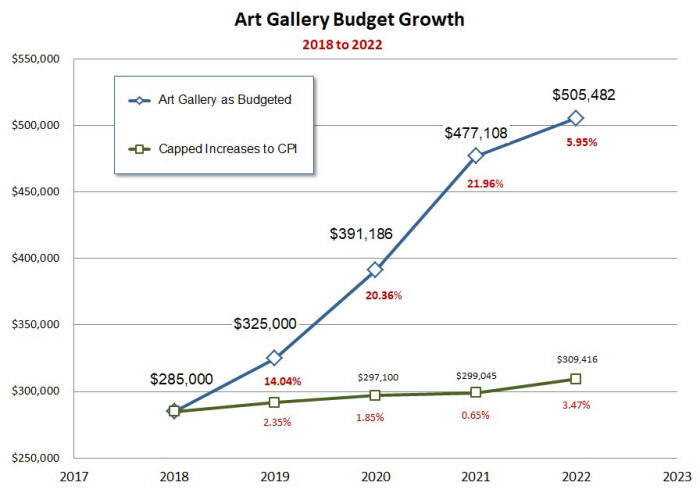 |
| Figure 18; Art Galley Budget Growth Source Owen Sound Budgets61 |
Expense and Tax Projections
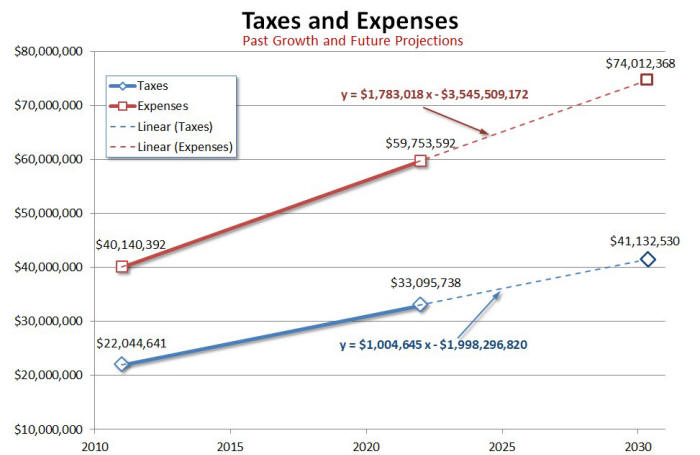 |
| Figure 19; Tax and Total Expense Growth 2011 to 2022 Source Owen Sound Audit Financial Statements1 |
Figure 19 above shows how taxes and total expenses grew from
2011 to 2022 and how they are projected to be in the future if the current
growth rates are maintained. In 2011 Owen Sound’s taxes were $22.0 million.
We see from the 2022 draft Audited Financial Statements that revenue from
taxation grew by 11.0 million, at a rate of $1.0 million per year, to $33.1
million in 2022.
When we project these changes into the future we see that in 2030 expenses
will have reached $74.0 million and taxes will have reached $41.1 million.
That’s a 24.3% increase in taxes and a 23.9% increase in expenses from 2022.
Comparing Sunshine Lists
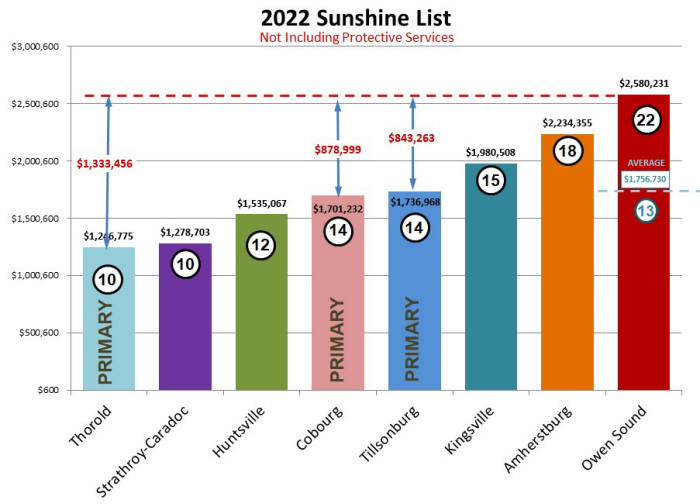 |
| Figure 19; Sunshine List Source Ontario Sunshine List56 |
The Ontario Sunshine List sheds some light on why Owen Sound’s Salaries and Benefits expense is so much greater than the other municipalities. We see in figure 19 that Owen Sound has 22 non-protective services employees making $100,000 or more. Owen Sound total of 22 employees; which is 9 employees or more than the 12.6 average of the three primary comparators. This is costing taxpayers $823,501 more on top salaries than average municipality in the primary comparator group. This suggests that the highest salaried employees, normally senior management, contribute 21.1% of the excessive salary and benefits expense.
These salaries account for more than one-third of the excessive Salaries and Benefits expenses. When we compare Owen Sound with Cobourg, its nearest comparator, we see that Owen Sound is spending $878,999 more on its highest paid employees than Cobourg and has 8 more employees making $100,000 or more than Cobourg. Therefore, if Owen Sound reduced the number in the ranks of the highest paid, just to match that of Cobourg, there would be a 2.8% reduction in taxes.
If we include Protective Services the situation gets much worse. Owen Sound’s total with Protective Services is 79 compared to Cobourg’s total with Protective Services which is 53 – at total difference of 26 employees.
What is most alarming is that there is evidence that suggests that Owen Sound’s median, after-tax household income will be declining relative to Cobourg’s. The number of people filing income taxes on wages in Cobourg grew by 2,530 workers or 26.9% between 2017 and 2021 52. During this same period this figure grew by only 260 or 1.9% in Owen Sound.
|
SUMMARY |
|
1. Owen Sound expenses are $11.0 million greater than the average of the Primary Comparators. 2. Salaries & Benefits expenses represent more than 1/3 of Owen Sound’s excessive expenses. 3. Owen Sound spends $3.8 million more on services than nearly identical municipality Cobourg. 4. Owen Sound has 9 more people on the Sunshine List at a cost of $823,501 more than Average. 5. The City Manager’s Office Budget grew by 150% in the 2 years between 2020 and 2022. 6. The Tom Thomson Art Gallery’s Budget grew by 77.3% during a four year period |
| Return to Top | Read How Owen Sound's Workforce Compares |