 |
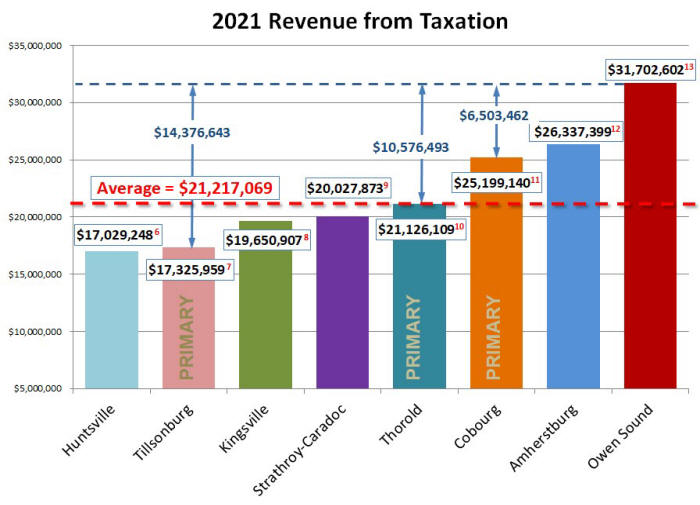
| Figure 1; Comparing Revenue from Taxation Source: Audited Financial Statements |
Comparing Municipal Revenues
Revenue from Taxation
|
|
| Figure 1; Comparing Revenue from Taxation Source: Audited Financial Statements |
As shown in figure 1, Owen Sound’s revenue from taxation is significantly greater than that of the comparator municipalities. The average of the three Primary Comparators is $21.2 million which is $10.5 million less than Owen Sound’s.
When we consider Cobourg by itself, which is nearly identical to Owen Sound, we
see that Cobourg’s revenue from taxation is $6.5 million less than Owen Sound’s.
In other words Owen Sound would need to reduce its revenue from taxation by $6.5
million or 20.5% in order to just match Cobourg. This also tells us that Cobourg
is either spending less on service delivery or has more non-taxation revenue
than Owen Sound, or a combination of both.
Taxation per Capita
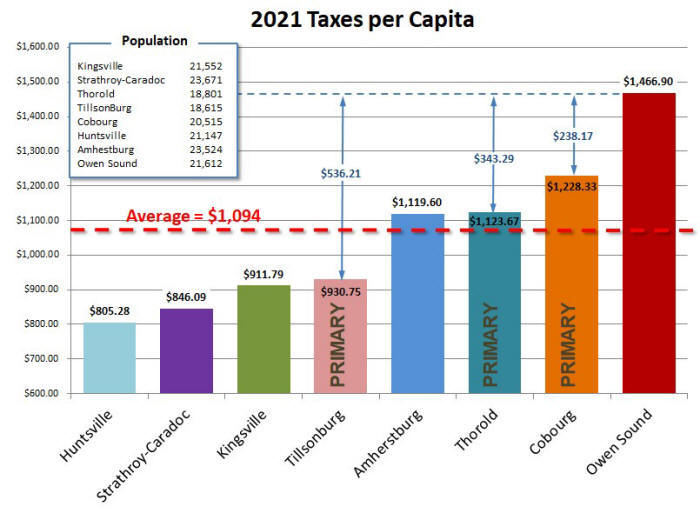 |
| Figure 2; Comparing Tax Revenue per Capita Source: Source: Audited Financial Statements |
Figure 2, shows the tax revenue per capita which essentially zeros out the impact of population. We see that at $1,467 per resident Owen Sound is $373 per resident higher than the average of $1,094 of the three primary comparators. When we look at Cobourg alone we see that Owen Sound’s taxation from taxation is $238 per resident greater than Cobourg’s.
The above charts show that Owen Sound’s revenue from taxation is significantly higher than the average of the top three comparator municipalities. In fact Owen Sound’s tax revenue was 49% greater than the average of three primary comparators and 26% greater than Cobourg’s revenue from taxation. Given that Owen Sound is nearly identical to Cobourg in Population, Area, Population-Density and Occupied Dwellings, we would expect that its revenue from taxation would also be nearly identical to Cobourg’s. However this is not the case.
Neichbourhood Tax Comparison
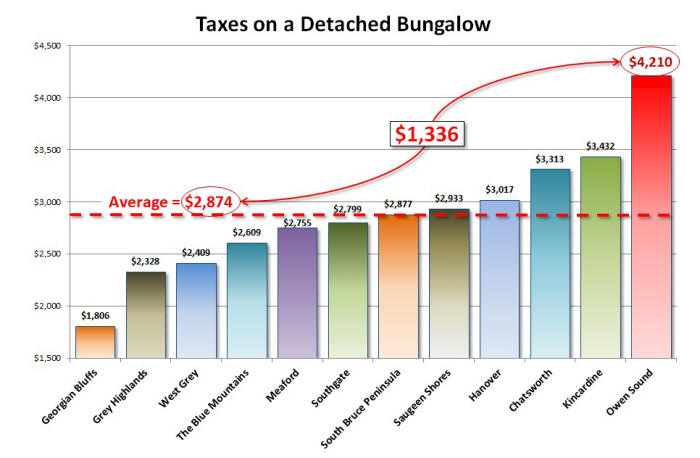 |
| Figure 3; Taxes on a Detached Bungalow in Grey/Bruce Counties Source: Source: 2022 BMA Report64 |
Now that we’ve seen how Owen Sound taxes compare to similarly sized municipalities in the study group I thought it would be informative to look at how Owen Sound taxes compare with municipalities in Grey/Bruce Counties. Above in figure 3 we see the comparative taxes on a single detached bungalow. As could be predicted from the previous comparison Owen Sound is by far the highest taxed municipality in both Grey and Bruce Counties. The difference is alarming. At $4,210 Owen Sound taxes are $1,336 above the average in Grey/Bruce. What’s even more alarming is that Owen Sound taxes are $2,404 higher than our neighbours in Georgian Bluffs. Is it any wonder why people are moving just next door to Georgian Bluffs? You can save $200 per month on your property taxes just by moving a couple of blocks and still be able to enjoy everything Owen Sound has to offer.
|
Think Critically When Listening to Political Spin at Budget Time |
|
I recall the Mayor saying that the 2023 Owen Sound tax increase was less than Georgian Bluffs as if that was good news. The reality is that 1% increase in taxes on Georgian Bluffs bungalow is $18.06 while a 1% increase on Owen Sound bungalow is $42.10 per year. Therefore 1% to Owen Sound taxes is equivalent to 2.3% to Georgian Bluffs taxes. Staff has proposed a 4.4% tax increase for 2024 which is equivalent to a Georgian Bluffs increase of 10.2% on a detached bungalow. |
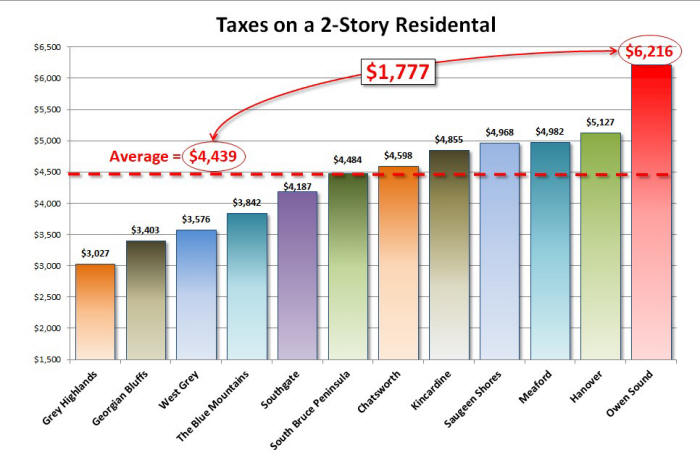 |
| Figure 4; Taxes on a Two Story Residence in Grey/Bruce Counties Source: Source: 2022 BMA Report64 |
Figure 4, shows the tax comparisons on a two-story residential home. Once again Owen Sound taxes are significantly higher than all other municipalities in Grey and Bruce Counties. Owen Sound taxes are actually $1,777 higher than the average and a whopping $2,813 higher that Georgian Bluffs.
|
|
| Figure 5; Taxes on a Multi-Residential Walk-Up in Grey/Bruce Counties Source: Source: 2022 BMA Report64 |
Owen Sound’s high taxes relative to its neighbours continues when it comes to apartments. As you can see from figure 5, Owen Sound’s taxes are $930 higher than the average and $1,108 higher than Georgian Bluffs. Given that landlords pass their tax expense on to their tenants, this means that anyone renting in Owen Sound will pay almost $100 more per month than a Georgian Bluffs renter due solely to the property tax differences.
Revenue from Other Sources
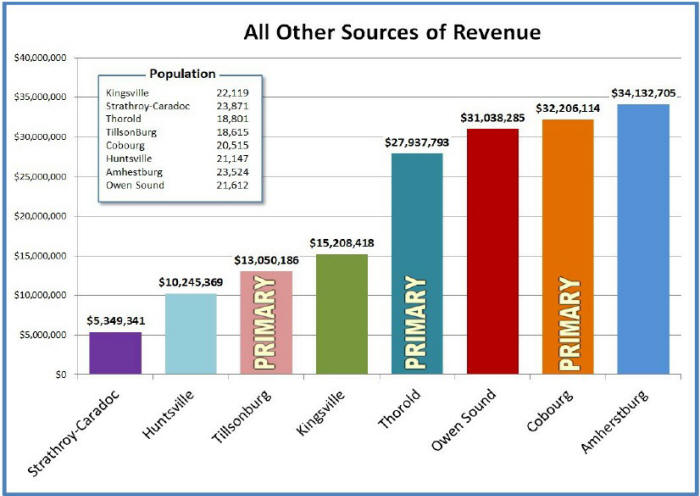 |
| Figure 6; Comparing Revenue from Other Sources Source Source: Audited Financial Statements |
Figure 6 shows that Cobourg, the municipality that is nearly identical to Owen Sound, has about $1 million more in revenue from other sources than Owen Sound. Also, Amherstburg earns about $3 million more in non-taxation revenue than Owen Sound. Amherstburg and Cobourg rely on taxes for 43.6% and 43.9% of their total revenue, respectively, while Owen Sound relies on taxes for 50.5% of its total revenue.
This suggests that there is room for Owen Sound to improve its revenue from other sources to reduce its dependence on taxation to fund municipal operations. To explore the potential in this area we will examine the economic opportunities that Amherstburg and Cobourg are leveraging to generate additional revenues in a later section.
|
SUMMARY |
|
1. Owen Sound’s Tax Revenue is $10.5 million higher than the average Primary Comparators 2. Owen Sound’s Tax Revenue is $6.5 million higher than the nearly identical Cobourg 3. Owen Sound’s Tax Revenue is 50.5% of Total Revenue while Cobourg’s is only 43.9% 4. Owen Sound’s Taxes are the higher than all municipalities in Grey and Bruce Counties 5. Owen Sound is too reliant on Tax Revenue and does not have one profit center 6. Owen Sound’s Ancillary or Other Sources revenue is grossly underperforming |