 |
| Figure 20; 2021 Non-Protective Services Workforces Source Ontario Financial Information Returns (FIR) 24 |
Comparing the Workforce
Workforce by the Numbers
|
|
| Figure 20; 2021 Non-Protective Services Workforces Source Ontario Financial Information Returns (FIR) 24 |
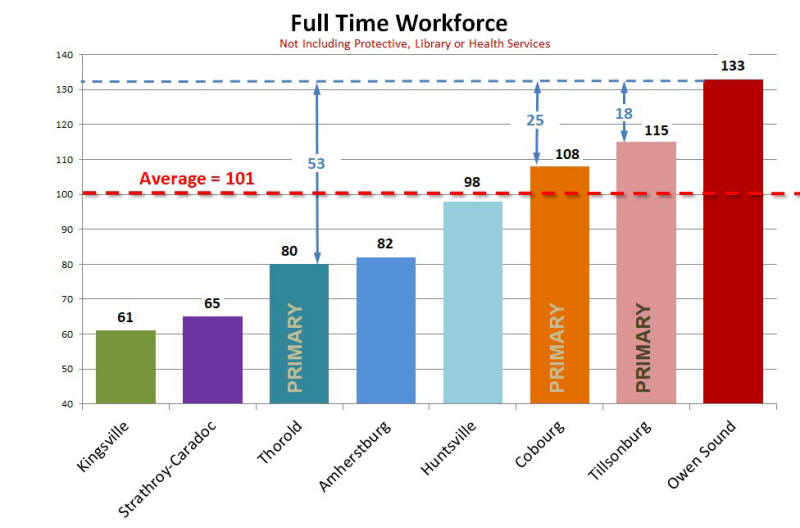
Ontario municipalities are required to submit information on their activities to the government each year in the form of Financial Information Returns (FIR). This information is available to the general public at: https://efis.fma.csc.gov.on.ca/fir/index.php/en/financial-information-return-en/. The data shown above in figure 20 was taken from sheet 80A from these returns. Summaries of Owen Sound’s and Cobourg’s returns are attached at Annex D.
Owen Sound employs significantly more staff than all other municipalities in the study group with 133 non-protective services employees. This mirrors Owen Sound’s excessive Salaries and Benefits expense shown in figure 9. Owen Sound employs 32 employees more than the average of the three primary comparator municipalities and 25 more than Cobourg the nearly identical comparator municipality. The bottom line is Owen Sound. city hall is overstaffed by somewhere between 25 and 32 employees.
The differences in the workforces between Owen Sound and Cobourg can also be seen in examining their current organization charts which are attached at Annexes E and F. These charts confirm Owen Sound employs significantly more employees than Cobourg. You can see a number of areas where Owen Sound uses more staff than Cobourg to perform the same functions by reviewing these charts. A couple of positions that stand out are; Corporate Services that is led by both a Director and a Manager of Corporate Services as well as a Deputy Treasurer, the Clerk’s Office that has 3 managers filling the role done by 2 managers in all other municipalities, and then there is the Senior Manager Strategic Initiatives which is a position unique to Owen Sound. The four charts below highlight some other anomalies in four departments, Administration, Public Works, Planning and Parks and Recreation. Again the data shown in the charts is from the Financial Information Returns.
|
|
|
|
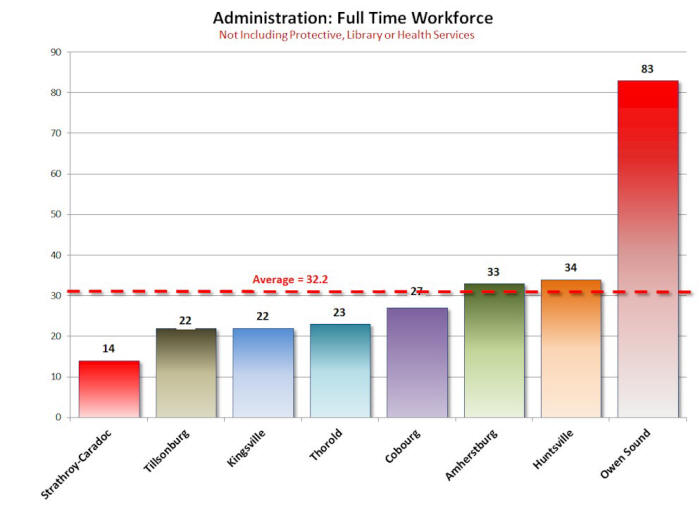
Figure 21 2021 Administration Workforces |
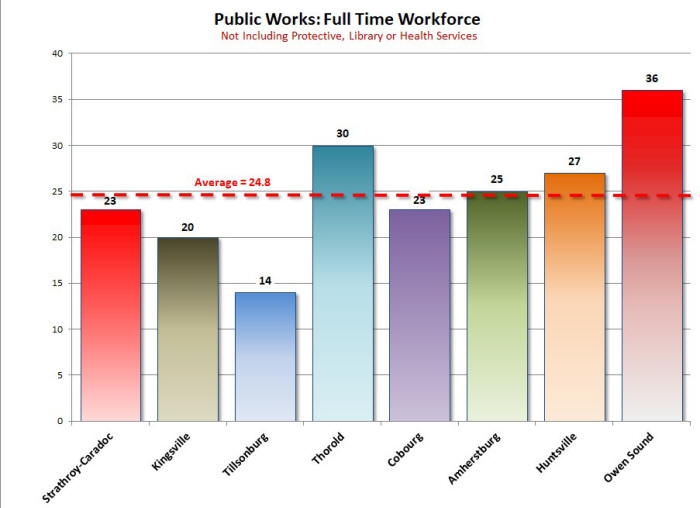
Figure 22; 2021 Public Works Workforces |
|
|
|
|
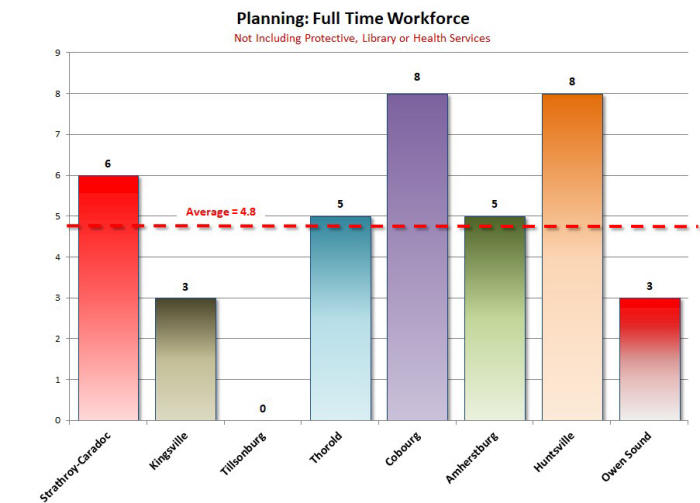
Figure 23; 2021 Planning Workforces |
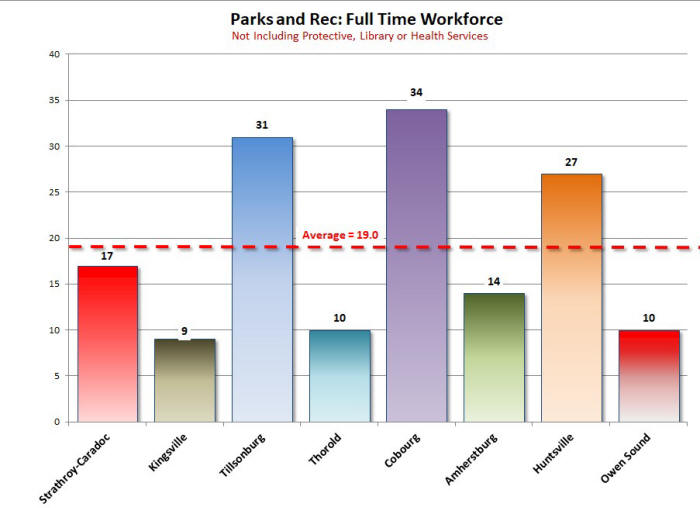
Figure 24; 2021 Parks & Rec Workforces |
|
Source Ontario Financial Information Returns (FIR) 24 |
|
The above four charts were developed from Owen Sound’s 2021 Financial Information Report which are summarized at Annex D. These clearly show the source of Owen Sound’s excessive workforce problem lays in the area of General Government or Administration which represents 62.4% of the workforce. Owen Sound’s Administration has a staff of 83 employees as compared to Cobourg’s 27, Thorold’s 23 and Tillsonburg’s 22. The average of these three primary comparators is 24. Owen Sound’s Administration has 59 more staff than the average or 245% of the average.
To a lesser degree Public Works also contributes to the overstaffing problem. Owen Sound has a Public Works staff of 36 compared to Cobourg’s 23, Thorold’s 30 and Tillsonburg’s 14. The average is 22. Therefore Owen Sound’s Public Works has 13 more staff or 163% of the average.
Also apparent in this chart are two departments that appear to be understaffed in comparison with the other municipalities. Owen Sound’s Planning Department has only 3 employees while Cobourg and Huntsville both have 8 planning employees. Although totally dependent on the number of parks, the Owen Sound also seems to be understaffed with only 10 employees.
|
SUMMARY |
|
1. Owen Sound employs 31 employees more than the average of the three primary comparators. 2. Owen Sound employs 24 employees more than the nearly identical municipality of Cobourg. 3. Owen Sound is the only municipality employing 3 managers in the Clerk’s Office. 4. Owen Sound Administration has 83 employees while Cobourg has only 27 employees. |