 |
|
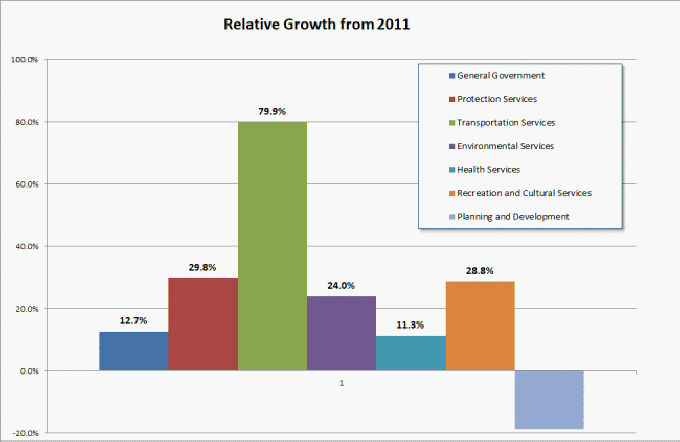
Figure 6; Relative Growth of Department Expenses between 2011 and 2020 |
City Department Growth
 |
|
Figure 6; Relative Growth of Department Expenses between 2011 and 2020 |
Individual Department
Growth as a Percentage between 2011 and 2020
Figure 6 gives us better understanding of how the cost of each
department grew between 2011 and 2020. For example the fastest growing
department, Transportation, cost $4.7 million in 2011 and in 2020 the cost of
Transportation was $8.5 million. Thatís a growth of $3.8 million or 79.9% during
the study period. The next highest growth area was Protective Services which
cost taxpayers 12.9 million in 2011 and $16.8 million in 2020 for a net growth
of $3.9 million or 29.8%. Although Protective Services grew by only 29.8% the
cost of this growth to taxpayers was nearly identical to $3.8 million that
Transportation grew during the study period.
In addition to Transportation and Protective Services there are two other areas whose growth exceeded the CPI growth of 18.3%. They are Recreational and Cultural Services at 29% and Environmental Services at 24%.
One area that stands out on this chart is Planning and Development, whose expenses are on track to decline by 20% annually. This could be a reflection of the population decline in Owen Sound that we will discuss in the next Section. Or, it could also be an example of an efficiently run department by a fiscally responsible manager.
 |
|
Figure 7; Distribution of Expense Growth by Department from 2011 to 2020 |
Figure 7 above, shows another way to look at Department growth as a percentage of total expense growth during the study period. Itís interesting to note that two areas Protective Services and Transportation, dominate the chart. As we discussed above Transportation and Protective Services grew $3.8 million and $3.9 million respectively from 2011 to 2020. Together these two services accounted for 62% of the total expense growth.
Government Services, Health Services and Planning & Development are clearly not part of the excessive expense growth problem. Recreation & Cultural Services combined with Environmental Services were responsible for 35.5% of the growth during this period. These departments along with Protective Services and Transportation account for 97.43% of the growth in expenses from 2011 to 2020.